.png)




Most D2C brands do not suffer from a lack of data. They suffer from a lack of decision-ready data.
Ad platforms report ROAS. Shopify reports sales. Klaviyo or your email platform reports revenue. Google Analytics reports traffic and events. Finance reports margin. The problem is that each tool tells a partial story, often using its own attribution rules. If a founder or growth team looks at those numbers in isolation, they can scale campaigns that look profitable but quietly damage cash flow.
Data-driven marketing is not about building the most complex dashboard. It is about knowing which metrics answer the questions that actually matter:
- Are we acquiring customers profitably?
- Are we converting enough demand into revenue?
- Are customers coming back without being over-discounted?
- Are our channels getting stronger or just more expensive?
- Are we growing in a way the business can afford?
For D2C brands in sports, fitness, wellness and consumer packaged goods, these questions matter even more. Margins can be tight, repeat purchase cycles vary and paid media costs can swing quickly. The right metrics give you a cleaner view of growth quality, not just top-line movement.
Start with one North Star metric, then build around it
A North Star metric should connect customer value with business value. For many D2C ecommerce brands, that might be profitable first purchase volume, contribution margin after marketing or repeat customer revenue. For a subscription-based supplement brand, it may be active subscribers with positive contribution margin by month two or three. For a premium fitness equipment brand, it may be qualified orders above a certain margin threshold.
The mistake is choosing a vanity metric as the North Star. Revenue alone can hide unprofitable growth. ROAS alone can hide low new-customer acquisition. Website sessions can rise without meaningful purchase intent.
A good North Star metric has three traits:
- It reflects real customer demand, not just traffic or impressions.
- It includes or strongly correlates with profitability.
- It can be influenced by marketing, offer, creative and site experience.
Once the North Star is clear, supporting metrics become easier to prioritize. You are not tracking everything equally. You are tracking the few numbers that explain why the main number is moving.
If your brand is still shaping its launch plan, it helps to define these metrics before you spend heavily. OPTYO’s guide on building a go-to-market strategy for D2C brands explains how positioning, offer design and channel selection should be aligned before launch.
Revenue metrics that reveal growth quality
Revenue is the easiest number to celebrate and one of the easiest to misread. A D2C brand should separate gross sales from the revenue that actually supports the business.
Track gross revenue, but do not stop there. Net revenue after discounts, refunds, returns and cancellations gives a more realistic view of demand. A high-revenue month driven by deep discounts may create short-term cash but train customers to wait for promotions.
Average order value is also useful, especially when paired with margin. If AOV rises because customers are buying bundles, that may improve economics. If AOV rises because shipping thresholds force larger carts but return rates increase, the gain may be weaker than it looks.
The revenue metrics worth watching most closely include:
- Gross revenue and net revenue
- Average order value
- Discount rate as a percentage of gross sales
- Refund and return rate
- Revenue from new customers versus returning customers
- Revenue by product, bundle and category
For sports and wellness brands, product-level revenue matters because not every SKU plays the same role. A low-margin hero product may be a strong acquisition hook if it leads to repeat purchases. A high-margin accessory may be useful for upsells and post-purchase flows. Data-driven marketing should clarify those roles instead of treating every sale as equal.
Customer acquisition cost, both blended and by channel
Customer acquisition cost, usually called CAC, tells you how much you spend to acquire a new customer. At a basic level, it is total acquisition spend divided by new customers acquired. The more useful version separates blended CAC from channel CAC.
Blended CAC includes your total marketing spend across channels. It helps you understand overall efficiency. Channel CAC shows how much it costs to acquire a customer through Meta, Google, TikTok, influencer campaigns, affiliates or other channels. Both matter because channel-level data can guide optimization, but blended CAC keeps you honest about total spend.
For example, Meta may show strong performance during a campaign, but if branded search, influencer codes and email are all taking partial credit for the same customers, channel-level CAC may look better than the business reality. Blended CAC helps reduce attribution noise.
Use CAC with context. A $45 CAC may be excellent for a brand with a $110 first order, 65 percent gross margin and strong repeat purchase behavior. The same CAC may be dangerous for a brand with a $55 first order and slow retention.
ROAS and MER: useful, but incomplete
Return on ad spend is one of the most watched marketing metrics in D2C. It is useful for comparing campaigns, ad sets and creative tests inside a platform. But ROAS should not be treated as the final measure of profitability.
Platform ROAS is affected by attribution settings, tracking limitations, view-through conversions and customer journey complexity. It can also reward retargeting too heavily because people closer to purchase are easier to convert.
Marketing efficiency ratio, or MER, is a broader metric. It compares total revenue to total marketing spend. If your brand generated $300,000 in revenue and spent $75,000 on marketing, your MER is 4.0. This does not tell you which campaign worked, but it does show whether marketing spend is efficient at the business level.
A practical approach is to use ROAS for tactical decisions and MER for business-level decisions. ROAS helps you understand which campaigns are worth improving. MER helps you see if your total marketing system is becoming more or less efficient over time.
This is where full-funnel measurement becomes important. If you only judge bottom-of-funnel campaigns, you may underinvest in demand creation. OPTYO’s article on why direct-to-consumer brands need full-funnel thinking breaks down why acquisition, conversion and retention should be measured as one connected system.
Conversion rate metrics across the buying journey
Sitewide conversion rate is useful, but it is too broad to diagnose problems. A D2C brand needs to track conversion at each step of the buying journey.
Look at product page view rate, add-to-cart rate, checkout initiation rate and purchase completion rate. If traffic is strong but product page views are weak, your landing page or navigation may be the issue. If add-to-cart rate is high but checkout completion is weak, the problem may be shipping cost, payment options, trust signals or delivery expectations.
You should also segment conversion rate by traffic source, device, landing page and customer type. Mobile conversion often differs from desktop conversion. Paid social visitors often behave differently from search visitors. New customers need more education and proof than returning customers.
Not every conversion happens in a simple ecommerce checkout. A premium fitness product may require a consultation. A local retail brand may depend on appointment bookings before purchase. Even an appointment-led bridal retailer like Le Michel Bruidsmode shows why some businesses need to measure booked appointments, visit quality and consultation-to-sale conversion rather than only online transactions.
For D2C brands with higher consideration products, this lesson is valuable. If your funnel includes quizzes, sample requests, subscriptions, consultations or retail locator clicks, those events deserve measurement. They are leading indicators of revenue, not secondary details.
Lifetime value and payback period
Customer lifetime value, or LTV, estimates how much revenue or profit a customer generates over time. Many D2C brands calculate LTV too optimistically by using revenue instead of contribution margin or by projecting future repeat purchases before enough data exists.
A cleaner approach is to track actual cohort behavior. For customers acquired in January, how much revenue did they generate in month one, month two, month three and month six? How much margin remained after product cost, shipping, discounts, payment fees and marketing?
Payback period is just as important. It tells you how long it takes to recover your acquisition cost. A brand may have strong 12-month LTV, but if cash payback takes nine months, scaling can create cash pressure.
For consumable products such as protein powder, hydration mixes, supplements or recovery products, repeat purchase behavior may justify a higher CAC. For durable products such as fitness gear or apparel, the brand may need stronger cross-sells, accessories or community-driven retention to increase LTV.
Track LTV and payback by acquisition source. Customers acquired through influencer partnerships may repeat differently than customers acquired through discount-heavy paid social campaigns. Organic search customers may have different intent than giveaway entrants. The blended number matters, but the segment-level number tells you where to invest.
Retention, repeat purchase and cohort metrics
Retention is where many D2C brands discover whether they have a product-market fit problem, a communication problem or an offer problem.
Repeat purchase rate shows the percentage of customers who buy again within a defined period. Purchase frequency shows how often they buy. Time between purchases helps you understand the natural replenishment or replacement cycle. Cohort retention shows how different customer groups behave over time.
For wellness and sports nutrition brands, retention metrics can reveal whether customers are building habits around the product. If a 30-serving supplement has a low second-purchase rate after 45 to 60 days, the issue may be product satisfaction, onboarding, usage education or subscription timing.
For apparel, accessories and equipment brands, retention may depend more on seasonality, product drops and community. A customer may not need the same product again soon, but they may buy complementary products if the lifecycle marketing is relevant.
Useful retention metrics include:
- Repeat purchase rate by cohort
- Time to second purchase
- Subscription activation and cancellation rate
- Churn rate for subscription products
- Returning customer revenue percentage
- Post-purchase email and SMS engagement
Do not view retention as only an email problem. Retention is shaped by product quality, delivery experience, packaging, customer support, education and the expectations created by ads.
Creative performance metrics
Creative is one of the biggest growth levers in modern D2C marketing. The challenge is that many teams judge creative only by immediate ROAS. That can cause brands to kill ads that are strong at generating attention, education or qualified traffic.
Track creative performance across stages. At the top of the funnel, thumbstop rate, hook rate, video hold rate and click-through rate can help identify which messages earn attention. In the middle of the funnel, landing page engagement, product page view rate and add-to-cart rate show whether the promise attracts the right audience. At the bottom of the funnel, purchase rate and CAC show whether the creative leads to efficient acquisition.
Creative metrics should be tagged by angle, format, audience, creator type and offer. For example, a fitness brand might compare performance across transformation stories, performance benefit claims, founder-led education, athlete testimonials and product demonstrations.
The goal is not just to find one winning ad. The goal is to build a repeatable learning system. If three different ads about recovery time outperform generic lifestyle creative, that insight should influence landing pages, email flows, product page copy and future creative briefs.
Email, SMS and owned audience metrics
Owned channels help D2C brands reduce reliance on paid media. But email and SMS should not be measured only by attributed revenue because attribution can overstate their impact, especially for campaigns sent to people who were already likely to buy.
Track list growth, opt-in source quality, flow revenue, campaign engagement and unsubscribe rate. More importantly, separate automated flows from promotional campaigns. Welcome flows, abandoned cart flows, post-purchase education and replenishment flows each serve a different purpose.
For D2C brands, owned audience metrics should answer practical questions. Are new subscribers becoming first-time buyers? Are customers receiving useful education after purchase? Are replenishment reminders timed correctly? Are promotions driving incremental sales or pulling forward revenue that would have happened anyway?
Healthy owned channels usually show a balance between revenue and trust. If campaign revenue rises but unsubscribe rates and spam complaints climb, the brand may be extracting too much short-term value from the list.
SEO and content metrics for D2C brands
SEO is often slower than paid media, but it can create durable demand if measured correctly. D2C brands should track organic sessions, non-branded clicks, rankings for commercial queries, assisted conversions and email captures from organic content.
Non-branded search is especially important because it shows whether people are discovering you through category, problem and comparison searches instead of only searching your brand name. A sports recovery brand, for example, may want visibility for queries around muscle soreness, cold plunge benefits, compression recovery or post-workout recovery tools.
Content should also be evaluated by business role. Some articles educate early-stage buyers. Some compare product types. Some support conversion by answering objections. Some reduce customer support questions after purchase.
If you are deciding which services should connect around growth, OPTYO’s breakdown of marketing agency services that matter most for D2C explains how performance marketing, creative, CRO, email and SEO work better when they share the same growth goals.
Build a dashboard that matches decision cadence
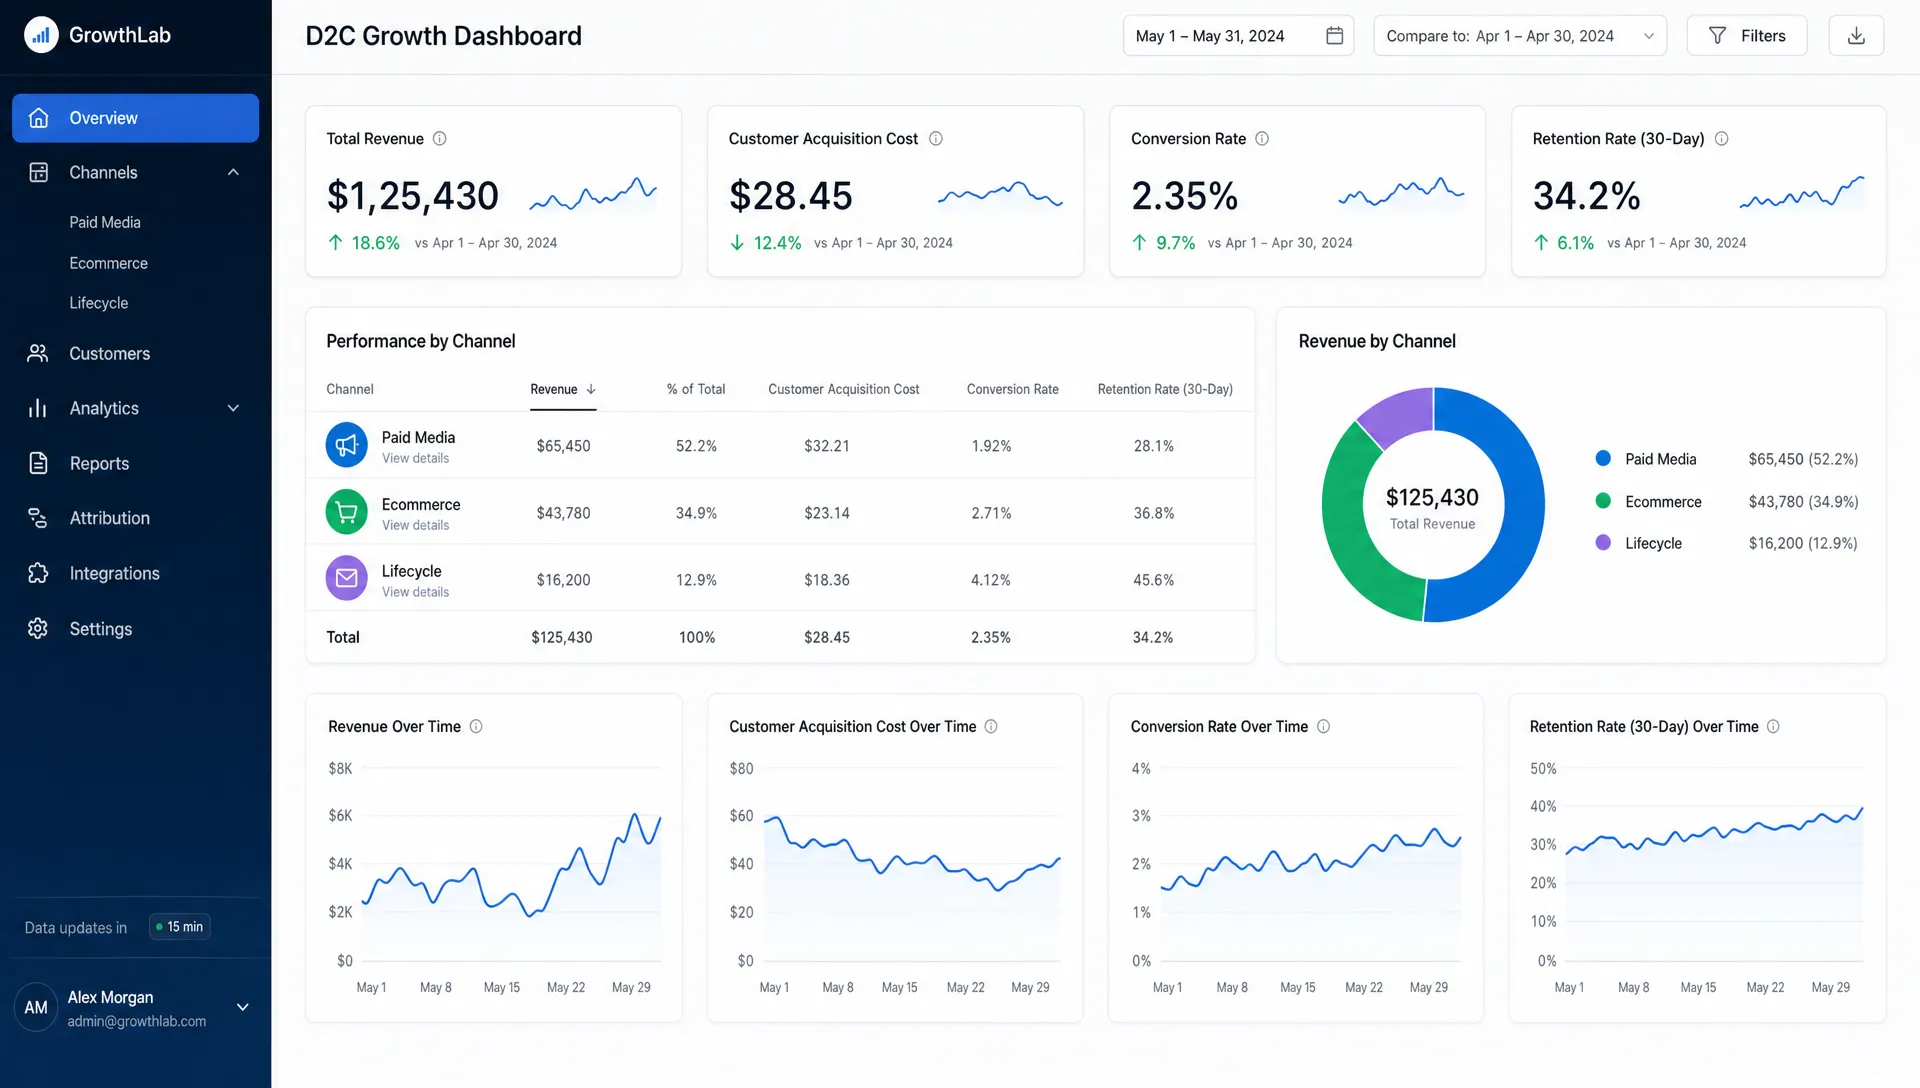
A good dashboard does not show every possible metric. It organizes metrics by how often decisions need to be made.
Daily metrics should focus on spend pacing, revenue, site issues and major performance anomalies. Weekly metrics should cover CAC, MER, conversion rate, creative tests, channel mix and inventory constraints. Monthly metrics should include cohort retention, LTV trends, payback period, contribution margin and customer mix. Quarterly metrics should address positioning, category expansion, product strategy and channel investment.
The cadence matters because not every metric should trigger immediate action. If you react daily to LTV, you will overinterpret noise. If you wait a month to notice broken checkout tracking, you will waste spend.
Your dashboard should also include definitions. Everyone on the team should know how CAC is calculated, whether revenue is gross or net, which attribution window is being used and how new customers are counted. Misaligned definitions create bad decisions even when the data is technically accurate.
Common mistakes in data-driven marketing
The most common mistake is optimizing for the metric that is easiest to see. Ad platform ROAS is visible, updated often and tempting to trust. But profitable growth requires a broader view.
Another mistake is ignoring contribution margin. If your marketing dashboard does not connect to gross margin, shipping costs, discounts and returns, it cannot tell you whether growth is profitable.
A third mistake is treating all customers as equal. New customers, repeat customers, subscribers, wholesale-influenced buyers, gift buyers and discount shoppers may behave differently. Segmenting these groups can change your growth strategy.
Finally, many brands fail to connect insights across functions. A creative test may reveal a winning customer pain point, but if that insight never reaches the product page, email team or product development process, the brand loses leverage.
Data-driven marketing works best when it becomes a shared operating system, not a reporting chore.
Frequently Asked Questions
What are the most important data-driven marketing metrics for D2C brands? The most important metrics are CAC, MER, contribution margin, conversion rate, AOV, repeat purchase rate, LTV, payback period and revenue by customer type. The right priority depends on your product category, margin and growth stage.
Is ROAS enough to measure marketing performance? No. ROAS is useful for campaign-level optimization, but it does not show full business profitability. D2C brands should pair ROAS with MER, CAC, contribution margin, retention and payback period.
How often should a D2C brand review marketing metrics? Spend, revenue and site health should be checked daily. CAC, MER, conversion and creative tests are usually best reviewed weekly. Retention, LTV, payback and margin trends need monthly or cohort-based analysis.
What is a good CAC for a D2C brand? A good CAC depends on your AOV, gross margin, repeat purchase rate and payback period. Instead of chasing a universal benchmark, compare CAC against contribution margin and expected customer value by cohort.
How can early-stage brands use data without overcomplicating reporting? Start with a simple dashboard that tracks net revenue, spend, new customers, CAC, conversion rate, AOV and repeat purchase rate. Add more advanced cohort, creative and channel metrics as volume grows.
Turn marketing metrics into growth decisions
Metrics only matter if they change what your team does next. For D2C brands, the goal is not to collect more reports. It is to connect acquisition, creative, conversion and retention into one growth system.
OPTYO helps sports, fitness and wellness brands approach growth with performance marketing, creative, ecommerce development, conversion optimization, email marketing, SEO, KPI reporting and brand strategy working together. If your team has the data but needs sharper decisions, OPTYO can help turn those numbers into a clearer path to profitable scale.